≡ Menu

Unilever PLC – Buy

Dove soap, Hellmans mayonnaise, Ben & Jerry’s ice cream, Surf detergent, CIF cleaner, Lipton tea are just a few of the household goods brands that Unilever owns. There’s a very good chance there are several Unilever products in your home right now.

I’ve been looking at the stock for a while now and believe now is the right time to add it to the Money Tree portfolio.

Revenue UNILEVER LOGO

Revenue declined 3% between 2012 and 2013 down to €49.8bn. However beneath this 3% decline was a -5.9% decline due to fx moves, primarily in it’s Emerging Markets. 

This exposure to FX surprises me. It was no secret that the US QE tap was going to be turned off at some stage and that this would lead to declines in EM currencies. I’m surprised that they left themselves exposed to such fx risks and that they clearly didn’t hedge out very far in the curve. I suspect (hope) they will have learnt their lesson.


Long Term Growth

Looking at Net Income they reported €4.8bn in 2013 versus €4.4bn in 2012, driven be a reduction of operating expenses from €44.3bn in 2012 to €42.2bn in 2013. A good control on costs is something I like.

Unilever has stated that it aims to achieve 75% of it’s sales from Emerging Markets by 2020. Currently 55% of sales derive from EM markets so over the next 6 years it’s planning quite an expansion of sales. Add on to this the fact that I would expect Developed Markets sales to bounce back with the continued economic recovery and over the next few years we should see some significant revenue growth.

Improving Margins

Perhaps one of the most pleasing ways in which the company has made progress in recent years is with the improvement of its margin. Both return on equity and assets continued to show an upward trend in 2013 and net margin increased to 10.6% in 2013 versus 9.4% in 2012.

If the company can keep improving it’s margins then I think the improved eps will be reflected in the share price. The management seems relatively confident of being able to keep the momentum going on the margin from which is a good sign.

Dividends

At the current price of £24 the dividend yield is roughly 3.8% which just about brings it into the zone where I get interested in a stock as an income play.

Unilever Dividend History

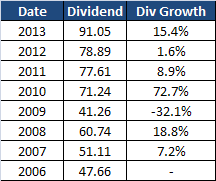
Since 2006 the average annual dividend growth has been 13.2% which is especially pleasing when you consider that this period includes 2009 when it slashed it’s dividend (down 32% on the 2008 payout) due to the global financial crisis.

Slightly less appealing is the dividend cover or payout ratio which currently stands at 63% which is lower than the industry average. However Unilever pays quarterly dividends which is appealing as it speeds up the compounding effect of dividend reinvestment.

Price

With the Price Earnings currently standing at 17.3 it’s not the cheapest share however other similar companies are more highly valued, for example: Reckitt Benckiser (18.6), L’Oreal (21.8) and Nestle (18.7).

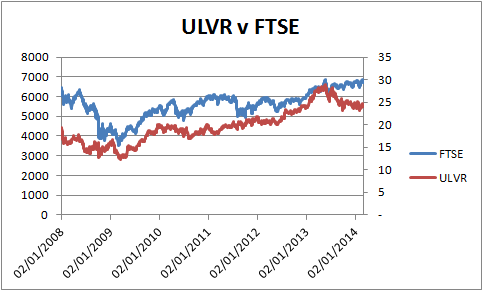
As you can see in the chart below ULVR has underperformed the FTSE in 2013 (primarily due to the EM fx issues mentioned above). This reduction in the price has brought it’s yield into an attractive level a little under 4%.

ULVR v FTSE

Summary

I consider Unilever a solid, defensive share with good long term prospects in terms of both income and profit growth. I see no reason why this can’t and won’t be translated into future increases to dividends.

Being a retail stock the business is pretty easy to understand. Unlike many companies out there, it doesn’t need to spend vast amounts of capital to constantly reinvent it’s technological edge (think most technology stocks) or fund huge new projects (think oil/mining stocks).

Most of it’s future income will come from maintaining and further developing it’s brands in both existing and new markets. This means that future growth (particularly into new markets) should be comparatively capital cheap compared to other industries. More importantly it means that it can pick and choose the rate at which it grows revenues as it is in control of which brands/products to roll out in which markets. There  is not much ‘risk’ in it’s capital expenditure.

The vast potential for Unilever to grow in the Emerging Markets should mean that growth can continue for many years to come. Any short term volatility in the Emerging Markets should be negated by this longer term growth opportunity. I’m looking to hold Unilever for the long term so am happy to ride out any short term volatility and hopefully watch the income it produces increase over time.

{ 15 comments… add one }
  • Financial Independence UK March 4, 2014, 12:35 pm

    Great review of Unilever, and for the same reasons as yourself I have been buying Unilever at a few points in the last month or so.
    I have primarily viewed it as a company that is paying a reasonable dividend that also has the opportunity to grow their profit and dividend by increasing their sales in emerging markets. I can live with the potential volatility of the currency exchange rates, as long as it keeps paying an increasing dividend, as when the countries become developed rather than emerging the exchange rate variability should drop and underpin a payout at an increased value.
    I hope you do really well on this company.

    Best Wishes
    FI UK

  • Monevator March 15, 2014, 9:26 am

    Another holder here, and I topped up on Friday.

    Agree with almost everything you’ve written, except the comments on FX hedging.

    Unilever is a massive company that can easily withstand a bit of emerging market currency buffeting. Hedging always has a cost, and it also requires the company to start thinking about hedging — i.e. to become more of a currency trader.

    I hope it hedges *less* where it does hedge, not more!

    If short-term investors are scared by short-term hits from currency swings, so be it. It gets us attractive entry points. 🙂

    Finally, are you familiar with the fund manager Tom Russo? Well worth reading his thoughts on the likes of Unilever and Nestle as long-term holds. 🙂

    • Under The Money Tree March 15, 2014, 12:22 pm

      I must disagree. If Unilever isn’t thinking about hedging there is something wrong. Hedging FX is cheap and relatively simple to do so I’m just a bit surprised that the known effects from tapering weren’t hedged more. Anyway I’m in the for the long run so a little price vol isn’t of major concern to me.

      I must admit i’ve not heard about Tom Russo….will have a google!

  • Monevator March 15, 2014, 2:08 pm

    I guess we’ll have to agree to disagree. 🙂

    I think that if the effects from tapering were so clear and obvious as to make hedging a no-brainer in advance, then there wouldn’t have been any effects from tapering — because currency traders would have gotten well in front of the price.

    I suspect it only looks obvious in retrospect.

    Given that, companies can waste a lot of money and time worrying about currency hedging, which is needless when you’re Unilever and operating in pretty much every country in the world. (Because it all balances out in the wash).

    Generally I think hedging makes sense if you’re exposed to something like a fixed income bond in a foreign currency with a fixed redemption date and par value. Hedging genuinely reduces risk there. With multinational equities, it doesn’t matter unless something else is going wrong, and with Unilever we both agree it isn’t.

    The company is sailing fine through the turbulence. 🙂

    • Under The Money Tree March 15, 2014, 3:03 pm

      Maybe i’m biased because my employer makes money by offering hedging services to corporates like Unilever, and I spend my days looking at trade proposals 🙂

  • Antony May 10, 2014, 11:05 am

    I am not entirely sure why with all the free resources online you choose to download historical stock and index data just in order to reproduce the relative performance chart of Unilever in Excel when Google Finance would do this so much more efficiently? Can you please explain why?

    Also, and more importantly, because the start point for both ULVR and the UKX (FTSE100 code on Goog Finance) do not start at the same place in your chart, the relative comparison chart is flawed, surely?!

    E.g.: http://tinyurl.com/ULVR5YRRELCHART

    • Under The Money Tree May 10, 2014, 3:23 pm

      Hi Antony,
      The reason why I have data downloaded already is because I track my portfolio in excel. As a result I regularly download prices for shares I own/watch and various indices. Plus I’ve been fiddling around with some trading algorithms based on technical analysis indicators, mainly research/testing that is part pleasure/personal and partly related to some things we’ve got going on at work. I tend to work on this sort of stuff and write posts for the site during my train commute, hence the stash of data I always tend to have.

      The comparison in my chart is perfectly valid – i’ve plotted each series on a different axis 😉

  • Antony May 11, 2014, 1:39 pm

    I guess it is just the poorly labeled chart then that confused me…no axis labels, no indication of which ‘FTSE’ index you are talking about (albeit relatively obvious given the level) – but I still contest that the chart I put up is far simpler to use than yours when trying to work out which of the two assets have outperformed the other.

    Tracking a portfolio in Excel is prehistoric these days. Have you not heard of Google Drive and Google Sheets? It is the equivalent of embedding live stock prices into an Excel-esque spreadsheet as per using a Bloomberg terminal…but oh so much cheaper (free) and with live prices for most of the most commonly required countries.

    😉

    • Under The Money Tree May 11, 2014, 2:07 pm

      Antony,

      If I could use drive or sheets at work then I’d definitely use that. However most of my PF tinkering takes place on the train in the morning/evenings so I’m reliant on working offline!

  • Antony May 11, 2014, 3:16 pm
    • Under The Money Tree May 11, 2014, 3:46 pm

      Thanks, looks like it might be of use!

  • Antony May 19, 2014, 9:49 pm

    Have you embraced Google Drive and the embedded share price features? Just wondering…

    • Under The Money Tree May 21, 2014, 1:03 pm

      Anthony,
      I wouldn’t say I’ve embraced it……but I have downloaded it and am starting to play around! I’ll be sure report back on progress!

      • Antony May 23, 2014, 1:00 pm

        Perhaps this will help you along…

        https://support.google.com/docs/answer/3093281?hl=en

        • Under The Money Tree May 23, 2014, 4:58 pm

          Thanks. One thing I can’t seem to figure out is how to write a function that just pulls in the price on the last tradign day of each month (i like to maintain monthly portfolio valuations). Any ideas?

Cancel reply

Leave a Comment