
Despite religiously tracking my net worth, the main metric I tend to focus on when evaluating my portfolio is the income that it generates. After all it is the portfolio income that will one day pay my bills and keep me in Werther Originals.
Monevator has written an excellent article on targeting your current monthly income as the number you need your portfolio to generate if you want to become truly financially independent and retire early. This article articulates perfectly the reasons why I focus on income generation as opposed to capital gain as part of my approach to investing.
However there is no escaping the fact that once you know how much you need your portfolio to produce every month, you then need to work out how much capital you will need in order to generate that income.
Of course the amount of capital required will depend entirely on the yield of your portfolio. The easiest way to work this out (and the method I use) is to use your portfolios historical yield.
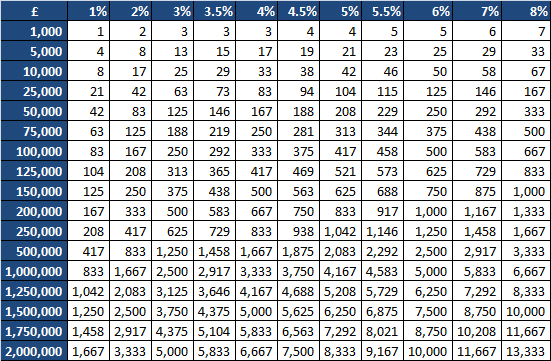
The chart below is very useful for giving you a rough idea of how much you need to invest in order to achieve a set monthly income.
Fig 1. Monthly Income Chart
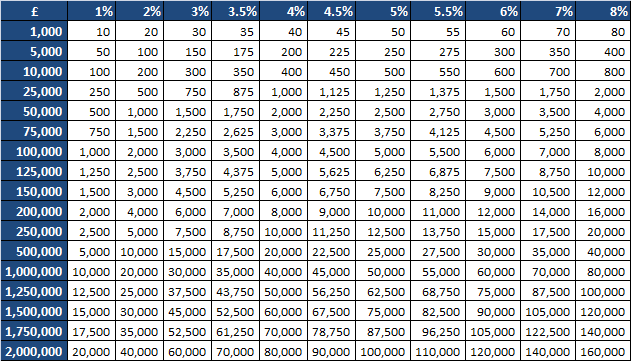
If you prefer working with annual figures then here’s the same information but with an annual view:
Fig 2. Annual Income Chart
You can use the above charts in two ways:
1. Check how much your current portfolio yields per month. Simply look up your portfolio size on the left hand column then read across to the column that’s header equates to the yield your portfolio generates. For example if you’ve got £50,000 invested in your ISA and it yields on average 5% then your currently generating income of approximately £208 per month in income.
2. Estimate your target portfolio size based on your required income. First decide on your desired monthly income. Then find the number on the grid that is closest in the column whose column header most closely matches your portfolios yield. Look across for the left hand column and you now know how big your portfolio needs to be. For example lets say my portfolio yields 5% and I require an income of £2,000 to cover my expenses. I’d need a portfolio of £500,000 in size to return £2,083 per month.
Hold on though…what about tax?
Of course the above tables show income received as pre tax. If all of your portfolio is squirrelled away in an ISA/NISA then no problemo. If however your investments are subject to tax you’ll need to factor in the income tax you’ll pay into the equation.
When I get stressed at work I close my eyes and remember that being there is enabling me to move downwards in these tables.
Think In Expense Replacement Terms
Being naturally risk adverse my main driver to become financial independent is to be able to cover my living expenses from the income my portfolio sheds off. Once I achieve that then I’ll also want to ensure that the portfolio can also keep up with inflation and if possible maintain a small amount of real term growth too.
Lets just worry about paying my expenses for now. Lets consider an example of how much I’d need in my portfolio to cover some of my main monthly expenses (assuming a 4.5% yield).
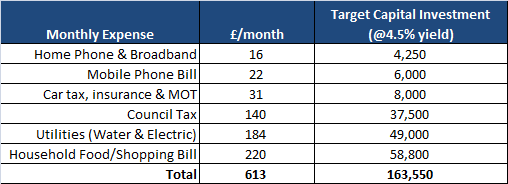
Based on the above chart I need to amass £163,550 before the average monthly income my ISA produces covers these expenses. In fact I wouldn’t even need £163k. Until the point when I started drawing the income the portfolio produces, the dividends received will be compounding up meaning that in reality I would need less than the £163k.
ISAs/NISAs are very attractive vehicles for a mid 30s chap like me to be saving into. There’s a purity about them in that any gains are free from tax. I find glancing at the tables above from time to time keeps me motivated to keep saving, keep investing and make the most of any capital I can acquire during this period of my life.
Hi UTMT,
I really like this post. What a nice little reminder about why we are doing all of this. I have played around with similar versions of the top 2 x tables for a while, but I haven’t thought about displaying my expenses in the way you have in your third table. I really like the simplicity and effectiveness of it!
I know what my total annual expenses are (roughly speaking), and I know what each individual bill cost me on an annual/monthly basis, but I haven’t ever thought of breaking each section down into what size investment I would need to cover each one before. You’ve inspired me to give it a try!
Thanks for reminding us all why we do this, and for sharing how you keep yourself going.
Cheers
Huw
Huw,
Glad you liked the post. I’m quite an impatient soul at heart so running such a long term investment strategy is a challenge to me at times. I find every now and then I need to sit down and take stock (excuse the pun 😉 ) of exactly what my portfolio would buy me in expense terms if I were to retire today.
I guess at some point i’ll list out all of my expenses and I could check them off as the portfolio grows. It al gets a bit confusing though when you start factoring in tax (on property related income) and the fact that my tax band will change when I do quit the day job.
Good luck!
I thoroughly enjoyed this post Mr UTMT. I also agree with Huw, the third table is a neat perspective on income requirements.
Thanks, this helps us to think beyond the usual 4% ‘safe’ drawdown rule.
Although once you finish work, your expenses are likely to change. Downwards, if you sit at home in pyjamas watching snooker all day, and upwards, if you fill your newly found free time with expensive hobbies and travel.
Very true. At this time on a Friday afternoon the pyjama/snooker options sounds very appealing!
Of course serious consideration needs to be given to the impact each of the following will have on you once you retire and live off your ill gotten gains:
– Regular expenses to income ratio
– Exceptional expenses (care costs, lamborghinis etc)
– Inflation
For now however I’m a little way off [voluntary] retirement, so all my focus is on building the portfolio quickly and with minimal risk to capital. I’ll consider the three point above when the pot is a bit bigger!
I am guessing that a lot of us reading and searching for blog posts like this will end up saving far more than we need for retirement.
For example, I am saving for early retirement, but am 36 and in a long term job that I love and will probably end up working in until 60. Maybe I will go I will go for early part time instead of early retirement.
I have thought along these lines previously, best part of £50 k to pay the council tax being less than encouraging!
The good thing is that the early years of saving leave the target apparently as far away as ever , as the years roll on, compounding takes over and you move forward very quickly indeed.
@Hariseldon – Too true, in the early years progress can appear painfully slow however as time roll on the wonders of compounding (+ additional investments along the way) make progress more and more tangible.
Great strategy to live off your portfolio. As long as you have a plan then you are doing better than most folks. Remember also these dividend paying companies raise dividends every year so you can rest easy as your yield grows. I hope to be able to grow my nest egg to cover expenses in 10 years. Good Luck.
Well some companies raise dividends every year! The tricky part of investing I find is to find the right balance between current yield and future dividend growth – the two don’t usually go hand in hand.
I’m not sure if I’m being completely dense, but the two tables for monthly and annual don’t seem to stack up. If £1,000 at 1% = £1 monthly, surely this = £12 a year (£1*12) not the £10 in the annual table? Am I missing something really obvious!?
I love this though, the motivation this has provided me to get saving is just what I needed!
James,
The £1 is actually rounded up from £0.833 (£1,000 x 1% /12 month = £0.834/month 😉
Glad you got some inspiration from the article!